2D Constraints
Apply a global monotonicity constraint along one dimension of a noisy tensor-product fit.
Source: Examples/Tutorials/RectilinearGridConstraints2D.m
Constrain one derivative direction on a rectilinear grid
The same ConstrainedSpline workflow extends to tensor-product grids. Here the fit is required to increase with y everywhere on the domain through GlobalConstraint.monotonicIncreasing:
rng(1)
x = linspace(0, 1, 18)';
y = linspace(0, 1, 20)';
[X, Y] = ndgrid(x, y);
Ftrue = 0.2 + 0.5*X + 0.3*Y + 0.1*sin(pi*X).*cos(pi*Y);
Fobs = Ftrue + 0.03*randn(size(Ftrue));

noiseModel = NormalDistribution(sigma=0.03);
freeFit = ConstrainedSpline.fromGriddedValues({x, y}, Fobs, S=[3 3], splineDOF=[10 10], distribution=noiseModel);
monotoneYFit = ConstrainedSpline.fromGriddedValues({x, y}, Fobs, S=[3 3], splineDOF=[10 10], distribution=noiseModel, constraints=GlobalConstraint.monotonicIncreasing(dimension=2));

xq = linspace(x(1), x(end), 29)';
yq = linspace(y(1), y(end), 31)';
[Xq, Yq] = ndgrid(xq, yq);

Ffree = freeFit(Xq, Yq);
Fmonotone = monotoneYFit(Xq, Yq);
Plot the unconstrained and constrained tensor-product fits.
figure(Position=[100 100 920 360])
tiledlayout(1, 2, TileSpacing="compact")

nexttile
imagesc(yq, xq, Ffree)
axis xy
axis tight
colorbar
xlabel("y")
ylabel("x")
title("Unconstrained fit")

nexttile
imagesc(yq, xq, Fmonotone)
axis xy
axis tight
colorbar
xlabel("y")
ylabel("x")
title("Monotone in y")
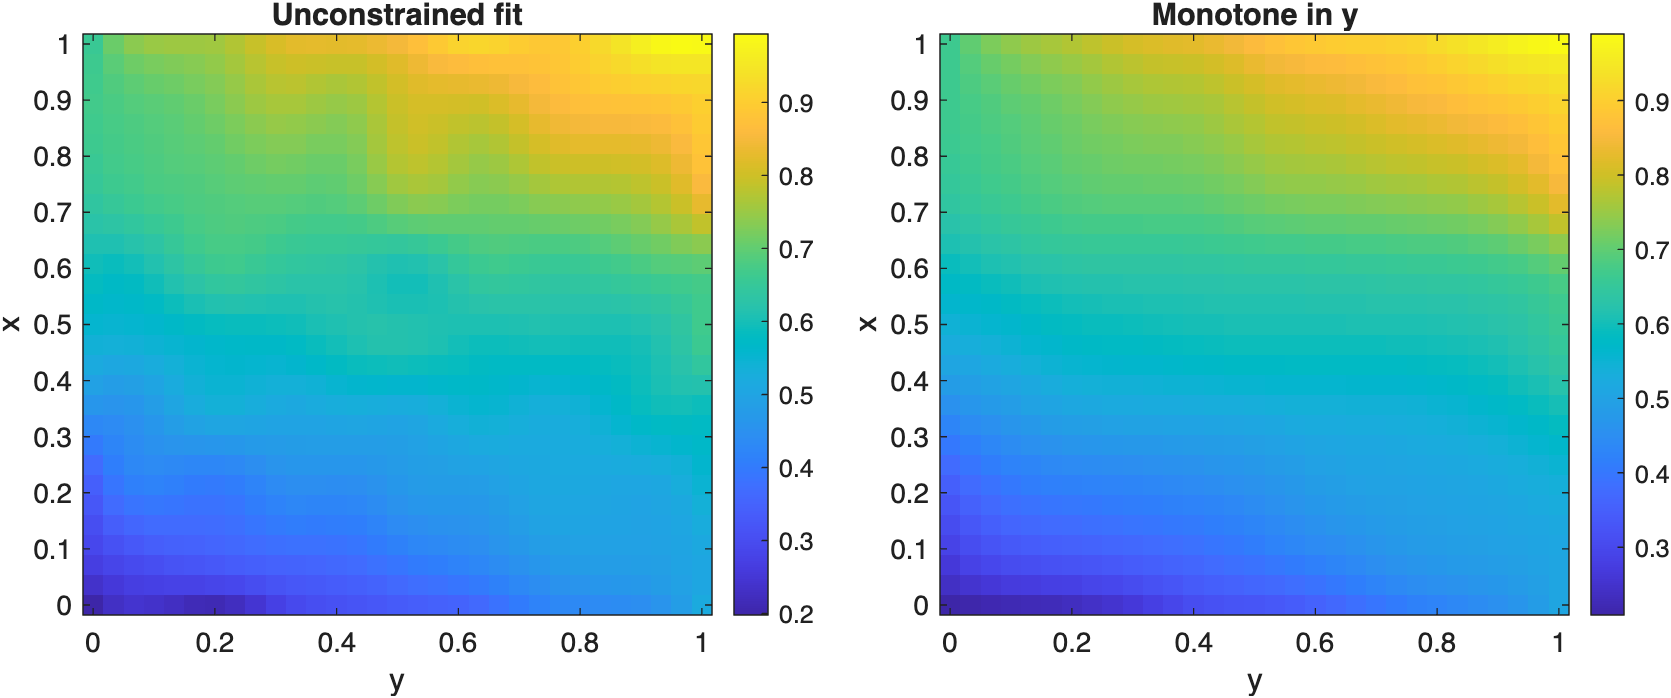
A global monotonicity constraint can be enforced along one coordinate direction of a rectilinear-grid spline fit.
Check the derivative in the constrained direction
Evaluating valueAtPoints with D=[0 1] differentiates with respect to y. The constrained fit keeps that derivative nonnegative throughout the query grid.
dFdyFree = freeFit.valueAtPoints(Xq, Yq, D=[0 1]);
dFdyMonotone = monotoneYFit.valueAtPoints(Xq, Yq, D=[0 1]);
Plot the derivative in the constrained direction for both fits.
figure(Position=[100 100 920 360])
tiledlayout(1, 2, TileSpacing="compact")

nexttile
imagesc(yq, xq, dFdyFree)
axis xy
axis tight
colorbar
xlabel("y")
ylabel("x")
title("Unconstrained df/dy")

nexttile
imagesc(yq, xq, dFdyMonotone)
axis xy
axis tight
colorbar
xlabel("y")
ylabel("x")
title("Constrained df/dy")
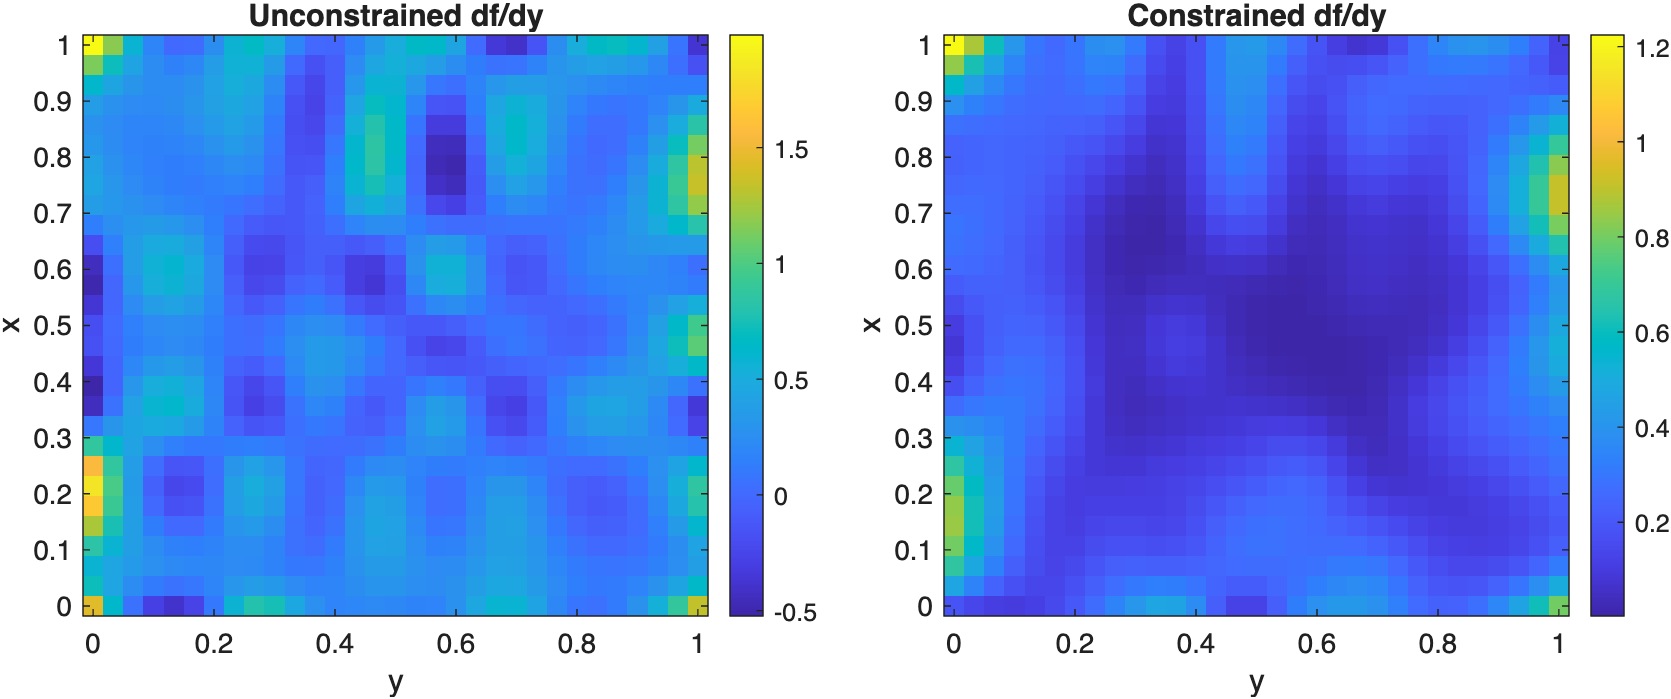
The monotone-in-y fit keeps the y-derivative nonnegative across the full rectilinear grid.